How to Conduct A/B Tests for Six UGC Story Templates: Which One Has Higher Conversion Rate

Cross‑border e‑commerce teams often prepare six short product videos at once: problem‑solving, TikTok review, unboxing, lifestyle, social proof, and custom. After the assets are delivered on schedule, the team still struggles to answer a simple question: Is the story template driving purchases, or are creator, length, discount, and audience changes causing the differences?
Six UGC story templates cannot be judged solely by view count or likes. To compare purchase conversion rates, you must keep the product, audience, budget rules, placement platform, landing page, discount conditions, and video length the same, only swapping the story template, and then observe view, click, add‑to‑cart, and purchase data simultaneously. Only conclusions drawn this way have a chance to be applied to the next round of assets, rather than staying at a gut‑feel level.
First, Break the Six UGC Story Templates into Testable Variables
The six templates are not six completely different product ads; they are six different narrative paths. The problem‑solving type first addresses user doubts and suits functional or efficiency products; the TikTok review type simulates a real‑world evaluation; the unboxing type creates anticipation through the opening process; the lifestyle type places the product in everyday usage scenes; the social proof type builds trust with reviews, multiple feedback, or results; the custom type revolves around special selling points, market culture, price range, or platform constraints.
In the first round of testing, each template should retain a similar four‑segment structure: opening hook, product showcase, detailed proof, and call‑to‑action. The problem‑solving template can start with “How do we handle this problem?” while the unboxing template starts with the packaging and first reaction, but both must present the product, explain its benefits, and give a CTA within a comparable time frame. Otherwise, template differences will be mixed with information‑volume differences.
Product, price, discount, creator persona, product link, landing page, and CTA must all be fixed. In particular, you cannot let one video use a discount code while another offers free shipping, or have one feature a professional reviewer and another use a regular consumer voice. If the team wants to analyze “story template,” they cannot change these conditions at the same time.
The six templates can be produced in 15‑second, 20‑second, or 30‑second versions, but a single A/B test round can only use one length. Keep one traceable asset for each template, recording template name, script version, creator persona, video length, and placement conditions. When later dissecting product selling points, you can refer to Dissecting High‑Conversion Product Ads, but you must not treat the performance in that case as the con conclusion for the current product.
How to Design the First‑Version Asset for Each Template
The first version does not need to make each template extremely complex, but each must let viewers know the product and usage context within the first few seconds. The problem‑solving type should first present the pain point, then show how the product reduces steps, saves time, or avoids trouble; the TikTok review type should retain an experiential judgment, e.g., “After a few days of use, I discovered…”, not just exaggerated facial expressions and product shots.
The unboxing type works best for products with packaging experiences, many accessories, or a surprise on first opening, but after unboxing there must be actual usage feedback. The lifestyle type should place the product in real daily settings such as kitchen, commute, gym, or home. The social proof type can use short multiple reviews, rating clips, or before‑and‑after results, but each proof must be tied to a specific selling point; “Everyone likes it” is not sufficient evidence.
The custom type is the most prone to misuse. It looks the most flexible and can mix problem‑solving, review, and lifestyle, but the script must record the exact logic: what to say first, when to show evidence, why the CTA appears at that point. If you only label the asset as “custom,” when conversion rates turn out low the team won’t know whether the issue was the opening, evidence order, or creator persona.
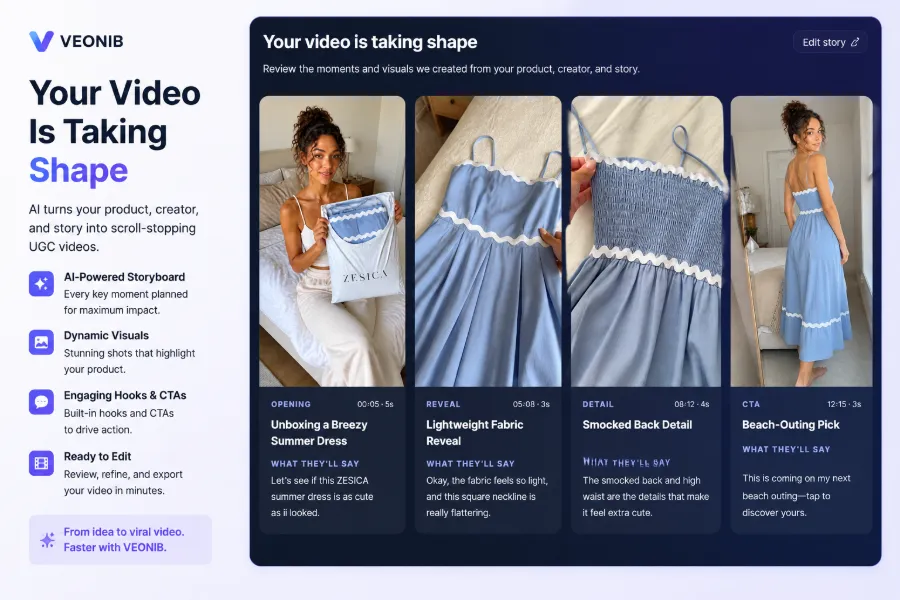
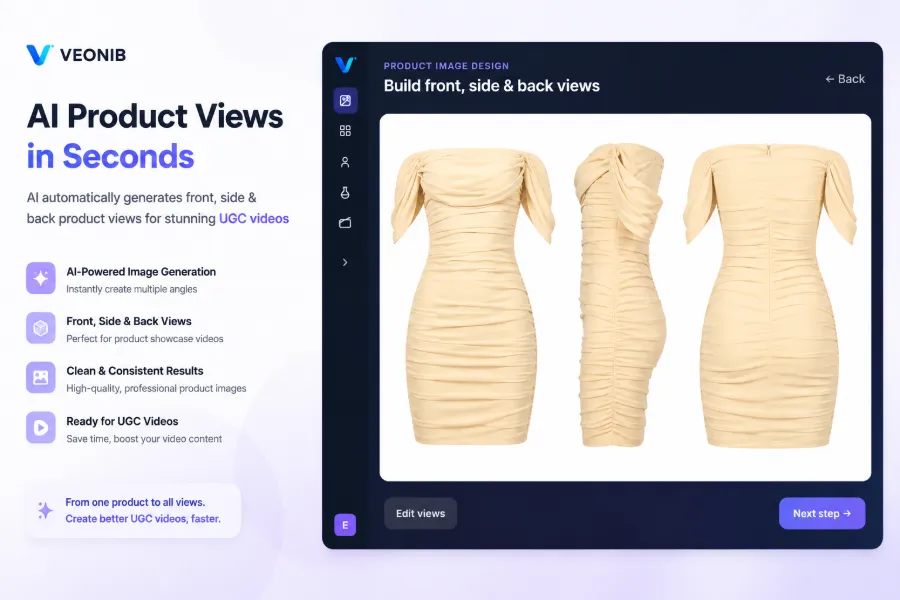
If the team generates scripts, storyboards, and UGC ad videos from the product link, the typical workflow reads the product title, images, price, and selling points, then creates multiple story versions. The asset‑generation process of VEONIB follows this scenario: the same product can first generate different scripts, which the team then checks to ensure product information is correctly incorporated, rather than creating six completely different ads from scratch.
Cross‑border placements also bring platform‑adaptation issues. TikTok’s vertical rhythm, Shopify product‑page video placement, and Amazon listing video environment differ, so assets cannot be exported once and copied directly. When producing for multiple platforms, refer to the Cross‑Platform Video Ad Guide and Cross‑Platform Asset Background, but each platform should still retain its own asset version records.
Compare Clicks, Add‑to‑Cart, and Purchases Under Identical Placement Conditions
A/B test groups are not just uploading the six videos at once. Ideal conditions are the same product, same audience, same placement platform, same budget rule, same landing page, and same discount conditions, with only the UGC story template changed. If the ad platform cannot perfectly split the audience, at least record audience segmentation, placement time, approval time, and budget changes to avoid mistaking distribution differences for creative differences.
Metrics should be recorded by funnel stage, not just click‑through rate:
- Impressions, three‑second view rate, or full‑view rate;
- Click‑through rate, landing‑page visits, and add‑to‑cart rate;
- Purchase volume, purchase conversion rate, and cost per purchase.
Click‑through rate can be calculated as clicks divided by impressions; purchase conversion rate must be clearly defined as purchases divided by clicks, or purchases divided by landing‑page visits. Either definition can be used, but all six templates must adopt the same one. Ad platforms usually record impressions, clicks, and purchases within the attribution window separately; backend numbers may not exactly match Shopify or Amazon order data, so the order system should still be used for verification.
One team once changed story template, video length, and creator persona in the same material round. Two days later, TikTok’s ad dashboard showed a higher click‑through rate for the new asset, and the team prepared to scale it up; however, purchase conversion rates did not improve, and Amazon and Shopify order data could not be linked to any single template. The problem was discovered only on day three, forcing the team to fix conditions and extend the test cycle, delaying scaling and launch.
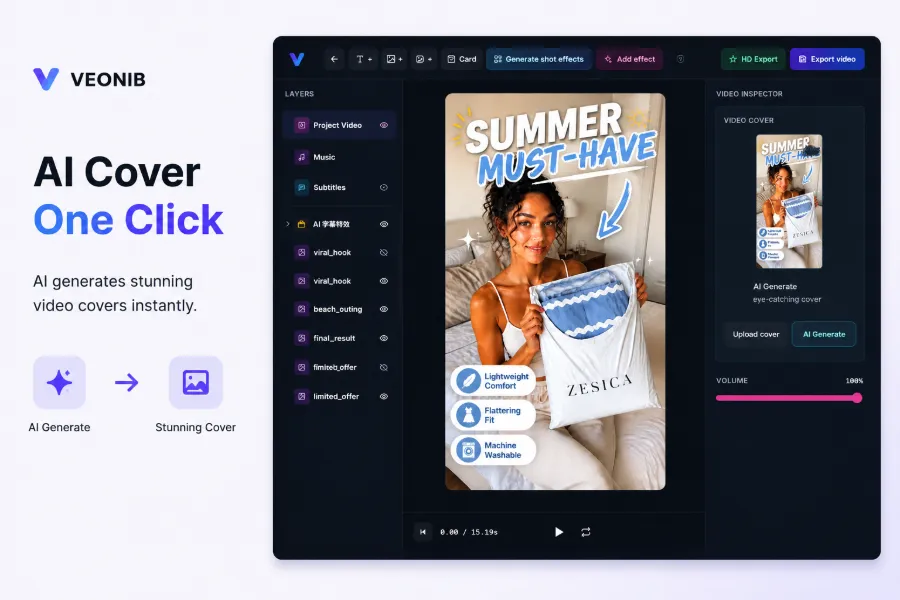
When producing at scale, VEONIB can be placed in the “generate multiple assets, then sync to different platforms” workflow, but the team still needs to clearly label template, length, market, and creator version in the filename. Automation reduces production steps but does not automatically solve attribution windows, inventory changes, or ad‑review timing differences. The relationship between Amazon product videos and purchase data can also be measured using the Amazon Product Video Conversion Method.
If the sample size is insufficient, do not declare a winner just because one video generated a few more purchases. At a minimum, confirm that all six assets received comparable impressions and clicks, check for any audience‑group allocation anomalies, and verify that inventory, price, coupons, and landing pages remained unchanged during the test. Platform review delays can also cause bias: one asset may only start receiving traffic on a weekend, while another has been running for days.
The template with the highest view‑completion rate does not necessarily yield the highest purchase conversion rate. Unboxing and lifestyle templates may be more entertaining, keeping viewers watching to the end, but they may not provide enough purchase motivation; problem‑solving templates may have lower view rates but, if the pain point matches the product, may deliver more stable post‑click purchase performance. This mismatch between viewing behavior and purchase persuasion is common.
Let Test Results Decide the Next Round of Assets, Not Just Keep the “Champion”
After the test ends, the team should save each metric separately: highest purchase conversion rate, lowest customer‑acquisition cost, highest add‑to‑cart rate, and highest view‑completion rate. They may belong to different templates. Keeping only one “champion” hides useful information, such as social proof yielding the most add‑to‑carts, problem‑solving delivering the most stable purchases, and TikTok review having the lowest click cost.
If you see high views but low clicks, first check whether the opening hook generated interest without a clear next step, and whether the selling point appears too late. High clicks but low purchases are more likely related to landing page, price, trust signals, delivery promises, or product‑audience fit. In that case, tweaking the video may be less effective than first reviewing the landing page.
Each of the six templates should have at least one traceable record, noting the actual video length (15 s, 20 s, or 30 s) and preserving script, creator persona, market, platform, audience, and budget conditions. The custom type especially requires this: it is easy to adapt to different markets but hardest to reuse. Without a concrete narrative structure, the next round can only guess the failure reasons again.
The next round should not overhaul every video at once. Keep the well‑performing template and adjust only one detail—opening hook, evidence order, creator persona, or CTA—and compare with the previous version. Batch‑asset production examples can be found in the AI Product Video Case Study. When publishing across platforms, also verify that files, copy, and links are synchronized; the Video Publishing Sync Process is only a procedural reference and cannot replace order‑attribution checks.
Different cross‑border markets, platforms, product categories, and price ranges may yield opposite results. A template that drives add‑to‑carts on TikTok via lifestyle scenes may not perform the same on an Amazon product page; high‑ticket items need more trust evidence, while low‑ticket items may rely more on clear discounts and fast CTAs. The testing method can be reused, but template rankings cannot be directly transferred.
Therefore, “Which template has the highest conversion rate?” can only be answered within a clearly defined product, audience, length, platform, and attribution window. The test yields a conditional data set—not a universally valid champion—showing which narrative keeps users watching, which drives clicks, which completes purchases, and whether those results merit the next round.
FAQ
Which of the six UGC story templates usually boosts purchase conversion rate the most?
No single template consistently wins across all products and markets. Problem‑solving often suits clearly functional products, but you still need purchase data from all six assets in the same placement period, not just view‑completion rates.
Which variables must stay consistent when A/B testing UGC story templates?
Product, price, discount, creator persona, audience, platform, landing page, CTA, and video length should be as consistent as possible. The six templates can each be made in 15 s, 20 s, or 30 s versions, but a single test round can only fix one length.
Should I look at click‑through rate, add‑to‑cart rate, or final purchase conversion rate?
Final purchase conversion rate determines the sale; click‑through and add‑to‑cart rates help locate funnel issues. The team should record all three and verify that ad‑platform data and Shopify or Amazon order data match within the same attribution window.
Can 15‑second, 20‑second, and 30‑second videos be tested together in the same round?
It is not recommended. Video length affects view‑completion, information density, and CTA timing. Fix one length, complete a round, then test length separately.
If click‑through rate is high but purchase conversion rate is low, what should I check first?
First examine the landing page, price, inventory, delivery promises, reviews, and discount conditions, then verify that the product’s selling points in the video match the page. If clicks are high but add‑to‑carts are low, the issue is usually product‑page fit or persuasive power, not the UGC story template itself.
Share Article