The churn ritual every cross-border operator needs to steal
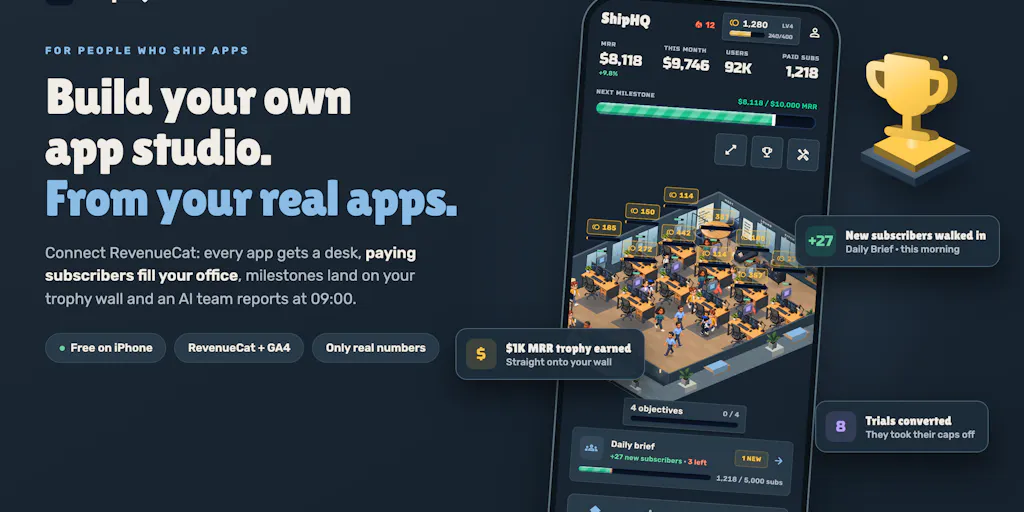
Cross-border sellers spend absurd amounts of energy on acquisition — TikTok Shop ad auctions, Amazon PPC bids, Shopify CRO tests — and almost none on the emotional and operational texture of losing a customer. That asymmetry is why a small indie iOS app called ShipHQ caught my attention this week, even though it has nothing to do with fulfillment, sourcing, or marketplace compliance. ShipHQ is a gamified “startup office” that turns RevenueCat subscription data into a living isometric workspace: paying subscribers become desks and people, churn walks out the door, and milestones become trophies on a wall. For a cross-border operator running a DTC brand with subscriptions, a membership tier, or a replenishment program, the underlying design choices here are worth studying — not because you should install a mobile game on top of your analytics, but because the maker solved a problem most sellers pretend doesn’t exist: retention data is boring, and boring data gets ignored.
What ShipHQ actually does, and why the framing matters
The maker is Rıdvan Uyan, an indie developer with several apps on the App Store. His pitch is refreshingly specific: he used to open RevenueCat every morning, watch MRR move by $12, close the tab, and feel nothing. Real strangers had paid for something he built, but a chart rendered the win invisible. That’s the burnout mechanism he’s targeting, and it’s real in e-commerce too. A Shopify merchant staring at a Shopify Analytics dashboard sees net sales, returning customer rate, and AOV as flat numbers. A TikTok Shop seller refreshing Seller Center sees GMV, refund rate, and a wall of order rows. Neither interface makes you feel the customer walking in or walking away.
ShipHQ’s answer is to connect RevenueCat with a single sign-in (no API keys required, per the launch post), assign each app a desk, and convert paying subscribers into office inhabitants. Add GA4 and traffic becomes the street outside. Every morning a “Daily Brief” replays the previous night: new subscribers queue at the door, it opens, confetti fires, the team claps. Trials wander in wearing a cap and remove it when they convert. Churn walks out, and someone pours a cup of water after them — a Turkish tradition the maker explains as “su gibi git, su gibi gel”: go smoothly like water, come back just as easily. It’s a send-off, not a funeral.
Milestones become trophies — 40-plus of them, including first $100, first 100 paying customers, and a 30-day streak. Desks earn “Company Cash” from real MRR, spendable on furniture, rooms, and coffee. Desk tiers (Pro Desk at $100 MRR, Product Pod at $1K, Prestige at $10K) can only be earned, never bought. On the Growth and HQ plans, an AI team holds a 09:00 standup: Leo on growth, Ada on market and competitors, Noah on App Store reviews with a reply draft, Emre on Reddit mentions, and Zoe on news — every note linking back to its source.
Pricing is free for up to two apps. Memberships — Mini, Growth, HQ — start at $4.99/month, and the launch offer running until October 15 gives every annual plan one month free. The code PRODUCTHUNT adds another month on HQ Annual for the first 100 redemptions. Android is not available yet; the maker said in the thread he hopes it lands in about a month.
The two rules that should embarrass most analytics tools
Two design constraints stand out, and both are direct rebukes to how mainstream e-commerce dashboards behave.
First: no invented numbers. A metric without a connected source shows a dash, never an estimate. Second: no retroactive trophies. The day you connect is your baseline, and only progress from there is celebrated. As the maker put it, a trophy for something nobody watched happen means nothing — which also means every milestone crossed before you installed is gone from your wall for good.
Now hold that against the average seller stack. Helium 10 estimates, third-party Amazon sales estimators, “projected” ROAS in ad dashboards, blended CAC calculators that quietly impute missing spend — the entire tooling ecosystem is built on confident-looking guesses. A dash is more honest than a nice-looking guess, and that’s a sentence I’d like printed on the wall of every SaaS sales deck I’ve ever sat through.
How it differs from the tools you already pay for
Let’s be precise about the comparison set, because “gamified analytics” is a crowded graveyard.
Against RevenueCat itself: RevenueCat is the source of truth and it’s excellent at telling you what happened. ShipHQ doesn’t replace it; it’s a presentation layer. The maker’s own framing — “RC is great at telling you what happened, I just wanted to actually see it happen” — is the correct scope. If you’re expecting new cohort math or LTV modeling, you’ll be disappointed.
Against Baremetrics, ProfitWell, or ChartMogul: those are benchmarking and dunning tools with serious financial reporting. ShipHQ has no dunning, no revenue recognition, no investor-grade exports. It’s a feeling machine, not a finance machine.
Against Klarvio or Braze — the retention-marketing layer most DTC brands actually use — ShipHQ does nothing to act on churn. There’s no win-back flow, no exit survey, no discount trigger. The water-pouring is symbolic. Your Klaviyo flow is the thing that actually brings the subscriber back.
Against generic habit apps like Streaks or gamified CRMs: ShipHQ’s advantage is that it’s wired to real money and refuses to fake it. Its disadvantage is that it’s a single-player experience for a founder, not a team operating system.
The honest positioning: ShipHQ sits between a personal habit tracker and a BI dashboard. It’s for the solo operator or small brand owner who needs a reason to open the numbers on a bad Tuesday.
Why Amazon and TikTok Shop sellers should care more than Shopify ones
Here’s the counterintuitive part. Shopify merchants already have a decent emotional relationship with their data — Shopify’s admin is clean, the returning-customer rate is visible, and apps like LoyaltyLion or Smile.io give you a rewards layer that makes retention feel tangible.
Amazon FBA sellers have the opposite problem. Amazon Seller Central is a hostile interface. Subscribe & Save data is buried. Repeat purchase rate is a report you have to build. Your “customers” are anonymized, and Amazon actively discourages you from owning the relationship. A tool that turns a real repeat-purchase number into something you look forward to opening has more marginal value for an FBA brand owner than for a Shopify DTC operator who already has Klaviyo open in another tab.
Same logic applies to TikTok Shop sellers, where GMV swings violently with the algorithm and refund rates can gut a week. When your numbers are that volatile, the emotional framing of the dashboard genuinely affects whether you engage with it or avoid it.
Where the math breaks
The maker is admirably candid about the failure mode, and I want to amplify it because it’s the real risk. A commenter, Gal Dayan, asked the sharpest question in the thread: if churn gets a send-off and new subscribers get applause, what does a genuinely quiet week look like? Does the office sit still, or does the contrast make a slow month feel worse than the raw number — pushing founders to avoid the Daily Brief exactly when they need it most?
The maker’s answer: on a quiet day the office doesn’t empty out. Existing paying customers are still at their desks. The brief says “no change.” A revenue dip reads as “a quieter chapter” instead of flashing red. The streak is about showing up, not about the numbers — so a dead week still counts if you open the app. But he conceded the contrast is real, and that a week of confetti followed by a week of nothing can feel worse than a flat line. His proposed fix: a quiet week should still surface something true, like how many people stayed.
That’s the right instinct, and it’s the thing I’d want to see built before I’d recommend this to anyone running a real business. Retention is the metric founders forget to celebrate, and it’s also the one that keeps the lights on during a slow acquisition month.
What cross-border sellers can borrow from this
Strip away the isometric office and there are four transferable ideas.
1. Make retention visible at the ritual level, not the report level. If your only retention touchpoint is a monthly Klaviyo cohort export, you’re never going to feel it. Build a daily or weekly digest — even a Slack bot pulling from your Shopify or Amazon data — that names returning customers, repeat orders, and subscribers who renewed. Naming beats counting.
2. Adopt the “no invented numbers” rule for your own reporting. Every estimate in your stack — blended CAC, projected LTV, attributed ROAS — is a place where you can lie to yourself. Audit one dashboard this month and replace every modeled number with either a real number or a dash. You’ll be shocked how much of your decision-making rests on guesses dressed as data.
3. Separate “showing up” streaks from performance streaks. The maker’s streak counts opening the app, not hitting a revenue target. That’s a genuinely good habit-design principle. For an operator, the equivalent is a daily 10-minute review ritual that you maintain regardless of whether the numbers are good. Consistency of attention is the actual skill.
4. Give churn a ritual. Not literally pouring water, but a deliberate, non-punitive process: an exit survey, a personal note, a documented reason code, a scheduled 60-day win-back. Most sellers treat churn as an accounting event. Treating it as a relationship event changes what you learn from it.
What I’d watch / test next
Three concrete things to do this week.
First, if you run any subscription or membership revenue — Shopify subscriptions, Amazon Subscribe & Save, a Patreon-style tier, anything — install ShipHQ on iOS if you’re on RevenueCat, connect one app, and use it for seven days. Don’t judge it on features; judge it on whether you opened it on day five. That’s the only metric that matters for a tool like this. Grab the PRODUCTHUNT code before the first 100 redemptions are gone if you want the extra HQ month.
Second, regardless of whether you install it, run the audit I mentioned: pick your primary analytics surface and mark every number that is modeled rather than measured. For most cross-border sellers, that’s 30–50% of what’s on screen. Then decide which of those you’d be comfortable defending to an investor or a business partner.
Third, watch for two things from this product over the next quarter: whether Android ships as promised, and whether the maker builds the “quiet week” feature he described — surfacing how many customers stayed during a slow period. If he ships that, ShipHQ stops being a novelty and starts being a retention tool with a genuinely differentiated point of view.
The bigger takeaway isn’t the app. It’s that the maker identified a real gap — analytics tools tell you what happened and never make you care — and that gap exists in every cross-border seller’s stack. Someone is going to build the e-commerce version of this. It might as well be you, or at least something you demand from the tools you already pay for.