The Most Dangerous Metric in Your Ops Stack Isn’t ROAS — It’s the One You’re Not Measuring at All
Every cross-border operator I know has the same religion: measure everything, trust nothing. We track ACOS down to the decimal, we split-test landing pages until the p-value cries uncle, we know our blended CPC across three marketplaces by heart. We’ve built dashboards that would make a quant blush. And yet, when a CFO asks the one question that actually matters — “Is the money we’re pouring into AI tools actually moving the roadmap?” — the honest answer is almost always a shrug. Not because we’re lazy. Because we don’t have the instrument to measure it.
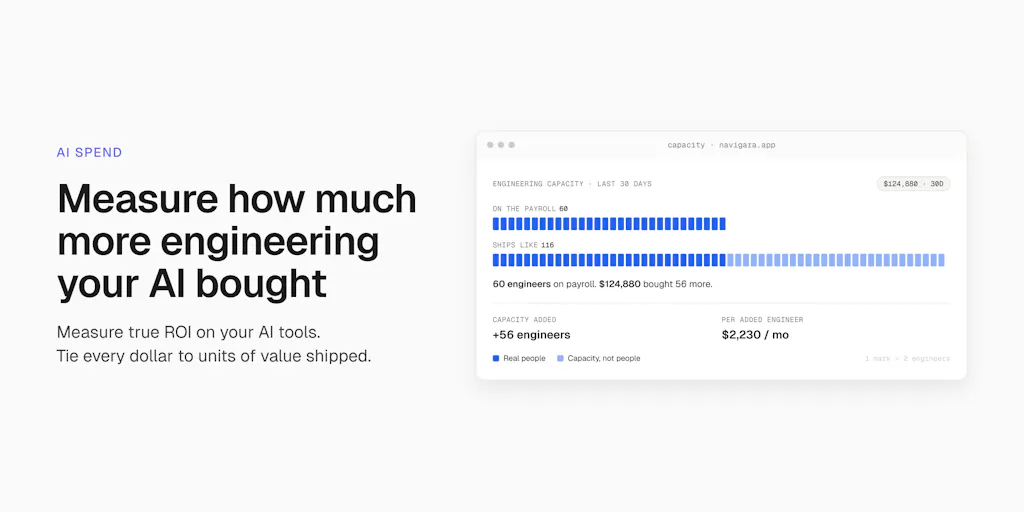
That’s why a Product Hunt launch for an engineering analytics tool called Navigara caught my eye in a way that another SaaS me-too wouldn’t. This isn’t a tool for your developers. It’s a lens for you — the operator who’s been told to “do more with AI” for eighteen months while watching the token bills climb and the feature velocity plateau. The problem Navigara solves isn’t confined to engineering orgs. It’s the same disease that infects every e-commerce operation that’s adopted AI tools without adopting AI accountability: spend is visible, but value is not. And if you’re running a DTC brand, an Amazon FBA business, or a marketplace operation, you’re about to feel this pain acutely — because your competitors are already measuring what you’re merely hoping.
The Problem: We’re All Flying Blind on AI Spend, and the Blindness Is Expensive
Let me paint the scene that Jirka Bachel, Navigara’s co-founder, describes in his launch post. He was a CTO trusting velocity charts and cycle times — the standard engineering metrics — until he realized they were telling him a story he couldn’t back up. Then a CFO asked whether Claude was producing real value for almost $150k a month or just producing invoices. The honest answer was “we think so.” Try saying that out loud while asking for a bigger token budget.
That moment is the most expensive sentence in modern operations. “We think so” is the sound of a budget being approved on vibes. And it’s not just engineering. Cross that over to e-commerce and the same scene plays out daily: a brand manager tells you Klaviyo’s AI subject lines lifted open rates, but can’t tell you what that lift contributed to roadmap — which, for a seller, means the quarterly product launch calendar, the new market entry, the SKU rationalization plan. The agency tells you their AI-generated ad creative “performed well,” but when you ask what share of the creative budget turned into shipped, on-strategy work, you get a blank stare.
The core issue Navigara identifies is that most organizations measure activity, not outcome. In engineering, that means counting lines of code or commits. In e-commerce, it means counting emails sent, ads launched, or SKUs listed. None of those numbers tell you whether the work was aligned with the roadmap. None of them tell you whether the spend was worth it. And none of them — critically — tell you whether your AI investment is making the roadmap move faster or just generating more busywork at scale.
Navigara’s answer is a metric they call Engineering Throughput Value (ETV). It reads your commit history, uses an LLM to understand the repo and explain what each change did, then scores how complex the merged work was. Not lines. Not commits. Refactor 400 lines down to 40 and you score higher than shipping 400 more. ETV splits into Features, Maintenance, and Documentation — and it measures against your team’s own pre-AI baseline. That’s the key move: not an absolute benchmark, but a relative one. Your team before AI versus your team after AI.
For a cross-border operator, the translation is immediate. Imagine applying that logic to your content pipeline: instead of counting blog posts published or emails sent, you score each piece on whether it advanced a strategic initiative — new market entry, new product category, new audience segment. Refactor a 400-word product description down to 40 words that converts better, and you score higher than shipping 400 words of fluff. That’s the discipline Navigara is bringing to engineering, and it’s the discipline most e-commerce teams are missing.
How It Differs From What’s Already Out There
The incumbent tools in the engineering analytics space — LinearB, Jellyfish, Swarmia — have been measuring developer productivity for years. But they measure flow: cycle time, lead time, WIP, throughput. They’re excellent at telling you how fast work moves through the system. They’re terrible at telling you whether the work matters. A team can have perfect cycle time and be shipping features nobody wants, aligned with a roadmap that’s wrong.
Navigara’s differentiation is the connection between token spend and roadmap alignment. The tool connects your AI spend (which LLM, how many tokens, what cost) to your roadmap (initiatives, epics, tickets) and puts a dollar figure next to work that’s aligned, work that has a ticket but no initiative, and work that’s entirely unaligned. That’s the Billy Beane move, as Bachel himself puts it in the comments: everyone pays for home runs and batting average because those look good on a highlight reel. On-base percentage was boring, cheap, and correlated with actually winning. Navigara’s on-base percentage is roadmap delivery — what share of your engineering spend, human and AI, turned into work that was on the roadmap.
The public data they’ve published is worth studying. Across the public commit history of Microsoft, Google, Cloudflare, OpenAI, Meta, and Vercel, ETV per engineer rose 116% between Q1 2025 and Q1 2026, measured across 676 contributors. That’s a stunning number — but it’s also a cautionary one. A 116% rise in ETV per engineer sounds like a triumph of AI adoption. But the same data reveals that a lot of the performance and code created inside companies was not aligned with the company roadmap. Spend was high, PRs were generated, but the roadmap didn’t move much faster. That’s the finding that should keep every operator up at night: you can be twice as “productive” and still not be moving the needle on what matters.
Why Amazon Sellers Should Care More Than Shopify Ones
Here’s where I’m going to make a contrarian call. Shopify operators — with their lean teams and direct-to-consumer focus — will look at Navigara and say, “That’s for engineering orgs, not for us.” And they’d be partially right. But Amazon FBA sellers should be paying closer attention, and here’s why: the Amazon marketplace is the closest thing e-commerce has to a roadmap-driven environment. Amazon’s algorithm rewards velocity, but it rewards aligned velocity — listings that match search intent, products that fit the category, pricing that moves the buy box. An Amazon seller who pumps out AI-generated listings without checking alignment against the marketplace roadmap (seasonality, keyword demand shifts, competitor positioning) is burning token budget on unaligned work. The seller who measures what share of their AI-generated content actually moves the needle on ranking and conversion is running their operation like Navigara’s ideal customer.
The tool’s security architecture — which I’ll get to below — also matters more for Amazon sellers, because your proprietary data (your sourcing costs, your PPC strategies, your supplier relationships) is your entire moat. The idea that you’d feed that into an AI tool without understanding how it’s processed is the kind of risk that ends businesses.
What Cross-Border Sellers Can Borrow From Navigara (Without Buying It)
You’re not going to install Navigara to measure your marketing team’s output — that’s not what it’s for. But the methodology is transferable, and there are three specific concepts you can steal this week.
First: the baseline-relative metric. Navigara measures against your team’s own pre-AI baseline. Not against industry averages, not against a competitor’s published numbers — against your before and after. The same logic should apply to your AI tooling. Before you adopt an AI-powered email tool, a generative ad platform, or an AI listing optimizer, set a baseline: open rates, conversion rates, time-to-launch, cost-per-acquisition. Then measure the AI period against that baseline, not against what the vendor’s case studies claim. The 116% ETV rise across those public tech companies sounds great — but your baseline is what matters.
Second: the alignment audit. Navigara’s most uncomfortable finding is that a lot of code being produced isn’t aligned with the roadmap. Run that audit on your own operation. Pull your last 30 days of AI-assisted work — emails, ads, product descriptions, customer service responses — and categorize each piece: aligned with a strategic initiative, has a ticket but no initiative, or completely unaligned. Most operators I talk to would be shocked by the share of unaligned work. That’s not necessarily waste — sometimes off-roadmap exploration is exactly what you need, as one commenter on the launch page pointed out about refactors that save a codebase without ever having had a ticket. But you need to know the split, because unaligned work is the first place to cut when budgets tighten.
Third: the dollar figure on everything. Navigara puts a $ next to unaligned work. That’s the move. Not “we spent $5k on AI tools this month” — but “we spent $5k on AI tools, and $2k of that went to work that wasn’t on the roadmap.” The moment you can say that sentence out loud, your CFO stops asking questions and starts making budget decisions based on data. The same discipline applies to your paid acquisition: don’t just track ROAS by channel; track ROAS by initiative. Which campaigns advanced the new market entry? Which ones were just keeping the lights on? Both can be profitable, but they’re not the same kind of investment.
Where the Math Breaks: My Honest Judgment on Navigara’s Limits
I want to be clear that I’m impressed by what Navigara is doing. But I’m also a skeptic by trade, and there are three places where the math gets shaky.
The mentoring problem. One commenter asked how the tool accounts for engineers who spend time mentoring, designing systems, or unblocking teammates. Bachel’s answer is elegant: ETV reads merged code, so mentoring shows up in the team’s output, not the mentor’s. Report at team level by default, and a staff engineer who spends a week unblocking four people has a bad personal ETV week and a team that shipped more — which is the trade you want to see. If mentoring is happening and the roadmap still isn’t moving, that’s a finding, not an accounting error. That’s a good answer. But it’s also a fragile one. In e-commerce, the equivalent is the senior operator who spends a week fixing a supplier relationship, untangling a logistics mess, or coaching a junior team member — none of which shows up in your ROAS dashboard. The team ships more, but the individual looks like a laggard. If you adopt this kind of metric, you must adopt the team-level reporting discipline too, or you’ll demoralize your best people.
The exploration vs. burn problem. Another commenter pushed on this: off-roadmap work isn’t always waste. Half the refactors that save a codebase never had a ticket. How does Navigara tell exploration apart from actual burn? The answer, based on the launch thread, is that it doesn’t fully — it categorizes work as aligned, ticketed-but-unaligned, or completely unaligned, and lets you put a dollar figure on each. But unaligned work that turns out to be a goldmine (a new product idea that came from a random AI experiment, an ad creative that breaks through precisely because it wasn’t formulaic) is the kind of thing that gets cut in a cost-optimization exercise. The tool’s bias is toward roadmap alignment, which is a management bias, not necessarily a value bias. You need to hold the line on some unaligned budget as an exploration fund.
The LLM-judging-LLM problem. This is the one that keeps me up at night. Navigara uses an LLM to understand the repo and explain what each change did, then scores complexity. That’s an AI scoring AI-generated code. The methodology is published, and the team seems thoughtful about it — but there’s an inherent circularity there. If the LLM that’s generating code and the LLM that’s scoring it share the same blind spots, you’re not measuring quality; you’re measuring self-consistency. The same risk applies if you try to use AI tools to measure your AI-generated marketing content. The score reflects what the model thinks is valuable, not necessarily what your customers — or the marketplace algorithm — actually reward. The only way to break that loop is to keep the final arbiter human: customer feedback, sales data, marketplace ranking. AI can generate hypotheses about value; only the market can confirm them.
The Security Posture Question
The comment thread also surfaced the question every operator should ask before adopting any AI tool: what happens to your proprietary data? Bachel’s answer is worth reading in full, but the short version is three deployment modes: fully on-prem for banks and regulated enterprises, an on-prem collector that reads git history locally and ships out only scores and metadata, and a hosted mode where code is processed but not retained and never used for training. They hold SOC 2 and are targeting ISO 27001 in Q3 ‘26.
For cross-border sellers, this is the template for evaluating any AI vendor. Your sourcing costs, your supplier terms, your marketplace strategies — that’s your intellectual property. If a tool can’t tell you exactly what happens to your data, walk away. The on-prem collector model — where the sensitive data never leaves your perimeter and only metadata ships out — is the right architecture for anyone handling proprietary e-commerce data. Demand it from your vendors.
What I’d Watch / Test Next
If you’re running a cross-border operation, here’s what I’d do this week — none of it requires buying Navigara, but all of it borrows from its methodology.
Run your baseline audit. Pick one AI-assisted function — email marketing, ad creative, or listing optimization — and pull 30 days of work. Categorize every piece as aligned with a strategic initiative, ticketed but unaligned, or completely unaligned. Put a dollar figure next to each bucket. You’ll likely find that 20-40% of your AI spend went to work that wasn’t on the roadmap. That’s not waste — but it’s unexamined, and unexamined spend is where margin leaks.
Set your team-level reporting discipline. If you’re going to measure AI output, measure it at the team level, not the individual level. The person who spends a week unblocking a supplier issue or mentoring a junior designer is doing work that shows up in everyone else’s numbers. If you score individuals on output without accounting for that, you’ll optimize for the wrong behavior.
Demand security architecture, not security theater. Before your next AI tool contract, ask for the deployment modes. Can the tool run on-prem or with an on-prem collector? What data leaves your perimeter? Is your data used for training? If the vendor can’t answer those questions clearly, that’s a red flag. The security best-practices doc Navigara published is a good template for what a real answer looks like.
Watch the live index. Navigara’s public data on top engineering teams is updated daily, and it’s a fascinating window into how the biggest tech companies are — or aren’t — converting AI spend into roadmap progress. The 116% ETV rise is the headline, but the alignment gap is the real story. Watch how that gap evolves. If the best-run engineering orgs in the world are struggling with AI alignment, you should assume your operation has the same disease — and start measuring it.
The throughline across all of this is simple: AI didn’t change the rules of business. It just made the cost of not measuring value much, much higher. The tools that win — whether they’re engineering analytics platforms or e-commerce dashboards — will be the ones that connect spend to roadmap, in dollars, with a baseline. That’s the metric your CFO actually wants. And if you can’t produce it yet, the best time to start was six months ago. The second-best time is this week.


