The Monday Morning Data Ritual That’s Killing Your Margin
If you run a cross-border e-commerce operation — juggling Amazon FBA inventory, Shopify storefronts, TikTok Shop campaigns, and ad spend across Google, Meta, and Amazon PPC — you already know the real bottleneck isn’t data scarcity. It’s the manual assembly line that turns raw numbers into a decision. Every Monday, you or someone on your team opens five tabs, exports three CSVs, screenshots two dashboards, pastes everything into ChatGPT or Claude, and spends 20 minutes re-explaining context the AI should already have. By the time you get an answer, the market has moved. That assembly line is what Databox Skills Marketplace aims to dismantle — and for anyone selling across multiple marketplaces and ad platforms, this isn’t a nicety. It’s a margin lever.
The Monday Morning Data Ritual That’s Killing Your Margin
I’ve watched enough operations teams burn two hours on reporting to know the pattern. Open Google Analytics 4. Screenshot traffic. Switch to Google Ads. Check spend. Pull last week from Meta Ads Manager. Export a CSV from Amazon Seller Central. Paste it into Claude. Wait. Realize the date range is wrong. Export again. By the time the analysis is ready, the rest of the day is gone.
This ritual is especially pernicious for cross-border operators because the data sources don’t share a common schema. Amazon’s “ad spend” includes different attribution windows than Google’s. Shopify’s conversion rate counts checkout sessions differently than TikTok Shop’s. You can’t just dump raw exports into an LLM and trust the output — because the model doesn’t know which definitions you use, which benchmarks are relevant for your category, or which anomalies signal a real problem versus a reporting lag. The bottleneck has moved from “getting the data” to “making the data speak the same language.” That’s where Databox has been building for years, and the Skills Marketplace is a direct shot at that pain point.
Why “Just Ask ChatGPT” Fails for Multi-Channel Operators
Everyone — including me — went through a phase where we thought AI would solve all analytics. Just paste the numbers, ask a question, get an answer. The problem with that approach for e-commerce operators is threefold.
First, context isn’t transferable. When you upload a CSV of last week’s Amazon PPC spend to ChatGPT, you have to re-explain what your target ACOS is, what your industry’s average conversion rate looks like, and which keywords you’re prioritizing. The model has no memory of your account structure. Every session starts from zero. That’s why Databox CEO Peter Caputa noted in the launch that “the output looked confident, but they kept finding the math wasn’t always right.” The fix isn’t better prompts — it’s connecting the AI to a system that already holds your definitions.
Second, benchmarks are hallucinated unless grounded. I’ve seen too many sellers act on AI-suggested “industry averages” that came from thin air. A model might tell you your TikTok Shop ROAS of 2.5 is “below average” when, for your specific category and geography, it’s actually strong. Databox’s Skills Marketplace addresses this by baking “what normal looks like” into each skill — pulling from your actual historical data, not a training corpus.
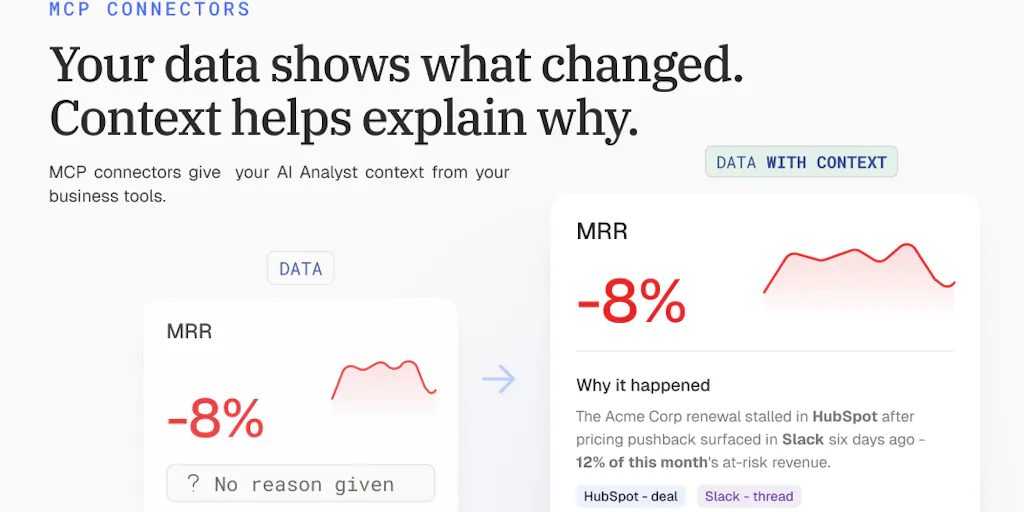
Third, manual exports introduce latency and error. Any operator who has accidentally uploaded last quarter’s data knows the feeling. The Skills Marketplace model connects directly to live data sources via Databox MCP (launched earlier this year) and the Custom Integrations pipeline — no CSVs, no date-range typos, no stale numbers. That alone is worth testing for anyone who runs weekly performance reviews across three marketplaces.
Databox Skills Marketplace: Pre-Built Workflows That Actually Work
The core insight behind this launch is unglamorous but powerful: “Knowing which analysis to run” is now harder than “running the analysis.” Databox’s Genie — their built-in AI analyst — already handled the execution. But users were sitting in front of a blank chat box, not sure what to ask. So the team built a library of 20+ pre-packaged analytical workflows, each one described as “a complete analytical workflow — the questions, the structure, the context, the output format — packaged into a single file.”
What that means for a cross-border seller: you can install a “Weekly GA4 Traffic Report” skill that already knows which metrics to pull (sessions, channel breakdown, top pages, conversion rate), what to compare against (prior period), and how to flag anomalies. Or a “Cross-Channel Paid Ads Summary” that aggregates spend, ROAS, and CTR from Google, Meta, and LinkedIn in one pass. A tester named Tadej Kelc reported that the cross-channel skill produced “ROAS by platform, CTR trends, budget pacing, and anomaly flags — all in one pass, in under a minute.” For anyone running weekly reporting across multiple accounts, the time difference is not incremental — it’s the entire task removed.
The marketplace also showcases partner-built skills that go deeper. Rick Kranz’s Sales Pulse connects to a CRM and compares two rolling four-week periods, surfacing deal concentration risk and coverage ratio before showing any charts. Manav Mehra’s Quick Financial Health Check pulls P&L, balance sheet, and cash flow — and displays visible data gaps instead of inventing numbers. That discipline — showing a gap rather than hallucinating — is exactly what every e-commerce operator should demand from any AI tool handling their revenue data.
Where the Math Breaks: The Silent Schema Problem
No tool is perfect, and the comments on the launch thread surfaced a specifically relevant weakness. Commenter Dipankar Sarkar asked whether skills pin a schema version or hash source field definitions, because “a source renames a field and quietly repoints it at slightly different semantics” could produce subtly wrong numbers. Databox’s Ziga Potocnik responded candidly: “Right now the matching is by name against the metric map, not a pinned schema version or field hash… That’s a real gap, not something we’ve solved yet.”
For an Amazon seller who relies on aggregate metrics like “Total Sales” or “Ad Spend” — which can be renamed or redefined by the platform without notice — this is a real risk. If Amazon silently changes the definition of “Impressions” in its API and Databox’s map still resolves by name, you could get confident-looking analysis that is subtly wrong. The fix, in the short term, is to cross-check key outputs against your raw platform dashboards until Databox adds schema-version pinning. Long term, this is a feature they need to prioritize, especially for enterprise sellers with high transaction volumes.
Why Amazon Sellers Should Care More Than Shopify Ones
Shopify store owners — especially DTC operators — tend to have a narrower data stack: GA4, Meta Ads, maybe Klaviyo. Their data is relatively clean because Shopify’s API is well-structured and the metrics are standard. Databox skills for those sources are probably ready to use out of the box.
Amazon sellers have a harder problem. Amazon’s reporting is fragmented across Seller Central, Amazon Advertising, Amazon Brand Analytics, and third-party tools like Helium 10 or Jungle Scout. The metrics don’t always agree — ask any seller who has compared Amazon’s “Total Sales” to their QuickBooks. A tool that can aggregate those disparate sources, apply consistent definitions, and run AI analysis on top is a bigger leap forward for an Amazon FBA operator than for a Shopify store owner. That’s where Databox’s Custom Integrations and MCP server become valuable — you can connect Amazon SP-API, Amazon Ads API, and your logistics data into one pipeline, then apply a custom skill to spot trends like “rising return rates in Germany” or “ad spend efficiency erosion in Japan.”
Three Things to Steal From This Launch (No Subscription Required)
Even if you don’t sign up for Databox immediately, the thinking behind the Skills Marketplace offers three practical moves for any cross-border operator.
1. Stop explaining your business to AI every Monday. If you use ChatGPT or Claude today for weekly reporting, create a saved prompt that includes your key metrics, benchmarks, and account structure. Better yet, use Databox’s free skills to see how they structure context — then replicate that in your own prompt system. The goal is to eliminate the 20-minute context warm-up.
2. Define your “metric map” before you connect anything. Databox’s skills rely on a metric map — a specification of which source fields map to which analytical metrics. If you’re connecting Amazon, Shopify, and Google Ads, write down: “What definition of ‘conversion rate’ do I use for each channel? What is my baseline ROAS for this quarter? Which date range do I compare week-over-week?” That exercise, done once, pays dividends regardless of tooling.
3. Automate one recurring report this week. Pick your most painful weekly report — cross-channel ad spend, top SKU performance by marketplace, return rate by region. Connect your data sources to a tool that supports live queries (could be Databox, could be Looker Studio with an API connector). Then configure a scheduled alert or summary. Even if it’s ugly, the time saved on assembly will fund the polish later.
What I’d Watch / Test Next
I’m going to test the Skills Marketplace with a real-world setup: an Amazon FBA account, a Shopify store, and a Google Ads account, all reporting into one Databox pipeline. I want to see whether the cross-channel skill can handle Amazon’s delayed attribution windows (where a click today leads to a purchase three days later) without producing skewed ROAS. I’ll also manually verify a week’s worth of outputs against raw platform exports to catch any “silent schema” drift — the issue that Dipankar flagged.
If Databox addresses the schema-version gap and adds partner skills specifically for Amazon PPC and marketplace inventory, this becomes a legitimate middle-stack tool for cross-border sellers who are tired of building one-off dashboards. For now, use it as a time-saver on assembly, but keep one foot in the raw data until the hallucination risk drops to zero. The Monday morning reporting ritual doesn’t have to define your week — but it will, until you connect the sources and let the analysis run itself.


